The Two Most Powerful Web Analytics Tools: Heatmap And Session Replay

Analyzing your website is essential to having a successful website in your hands. To analyze how your website is performing, there are many options available today. These include heatmaps and session replay. These two tools are among the modern data visualization tools.
It would be difficult to determine which is better and which is worse. Nor is it the purpose of this blog article to show you which is better to use and which is not. After all, each tool serves a different purpose, so it depends on what you want to use them for. In this article, I will explain the basics of both data visualization tools so that you can identify which one you need when analyzing your website.
About heatmaps
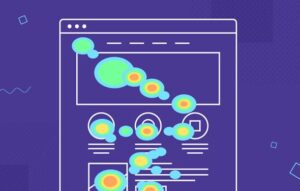
Heatmaps use graphical elements to tell you which parts of your website are popular with visitors. Where visitors click the most and which parts of your site receive the least attention. The heatmap lets you see how much time users spend on each area of your website. When it comes to heatmaps, there is not one type, but 3. We include clickable, scrollable, and segment heatmaps.
If you want to analyze a website using a heatmap, you don’t need to use all 3 tools, so it’s important to know the difference between each type.
Clickable Heatmap
They don’t need much explanation, as click heatmaps show you which parts of your website are getting the most clicks. Clicks are recorded in the click heatmap, which you can analyze to see which parts of your website are outstanding and which need improvement.
Importantly, if you want to develop an SEO-friendly site, you need to know which areas of the website are popular and which are not. If you can identify early on which areas are getting the most clicks, it is a good idea to place CTA tools in those areas as well, as this will increase conversions.
So the click heatmap can help you to know which parts of your website you need to improve and optimize.
Scrolling Heatmap
This type takes into account how many users scroll down your website. I strongly recommend the use of a scrolling heatmap for those who have a blog interface, as it is important to measure how much time visitors spend reading an article on a blog. How many minutes do they spend reading the text? They can help you know where to place links on your blog. After all, if they are placed at the very end, they may not get there. So I recommend that you place both internal and external links in popular places on your website, where your blog readers are likely or more likely to find them. I think it is important to analyze this area.
Segment heatmap
The segment heatmap lets you know where a visitor came from on your website. It can also fully track a user’s origin and activity on your website and use this data to evaluate what they see.
It can interpret where a visitor came from to the level of whether they arrived organically or whether they came across your website through some paid advertisement where they clicked, or whether they came to your website through email or social media platforms. Segment heatmaps can measure and analyze all of this.
Furthermore, this type of analytics tool can also provide you with demographic data.
Now that we’ve analyzed what each heatmap can analyze, let’s move on to color. For those who prefer visual tools, a heatmap can be a great friend. With heatmaps, you can use colors to get extra information. These colors need to be interpreted. In a way that the warm colors will reflect the places on your website that are popular and get a lot of clicks. Warm colors are shades of red and orange. And cool colors, such as blues and shades, will show you where you need to pay more attention to make your website work optimally.
Now for the second big favorite.
The Session Replay
This tool can also be considered a modern data visualization tool. If you have this tool, you can look back at actions such as mouse movements on your website, scrolling down and up, resizing the screen, and much more. Session replay can help you improve many critical areas, such as helping to improve the user experience, helping you to achieve a better conversion rate, and being able to show you what issues your site needs to fix.

How does it work?
If you already have a session replay, it is important that you separate old and new users on your website before you start analyzing the processes. After all, an old and a new visitor move in a completely different way on a site they know or don’t know. If you put them together, you might not get a real result.
It works very simply because session replay can record and store the movements on your website, which you can analyze. However, I think it’s important to stress that you don’t want to solve all problems at once. Focus on the factors that need to be improved and that can help improve conversion rates and user experience. There’s no such thing as a perfect website, it’s okay if yours has little flaws.
I don’t want to go into details, just to list a few things I think session replay is beneficial for:
- Can design the security of your website
- Leads to a good user experience
- Increase the conversion rate of your website
- Find out how visitors react to new features
Summary
As I mentioned at the beginning, these two data visualization tools are not the only ones out there, but I think they provide the most useful information. You don’t need to use both tools at the same time, but if you don’t want to miss anything and want an SEO-friendly site, I recommend using both the heatmap and session replay in parallel. You won’t have a disadvantage in any way. I hope I was able to help you and now you will feel free to use both data visualization tools. Good luck!